Coro2vid19 ShinyApp
build with: ♥ | R | shiny | keras | TensorFlow | plotly | tidyverse
Coro2vid-19
Leveraging knowledge about coronaviruses to fight Covid-19
Inspired by the WirVsVirus hackathon of the German Bundesregierung, HackZurich intiated a similar hackathon one week later. The codevscovid-19 hackathon saw 300+ submissions from teams all over the world all with the unified aim to leverage our data science, machine learning, AI, web application and other tech-related skills to contribue to the ongoing coronavirus crises.
Together with Cosima Meyer, we developed over 72 hours the ShinyApp Coro2vid-19. Our goal is to help users to quickly identify relevant articles based on coronavirus on a specific topic using keyword searches as well as to identify related articles and groups of authors. We use the abstract of over 22,000 articles related to coronavirus covering the period from 1955-2020 from Kaggle to find similarities in their content using word-embedding similarities. This way, users can explore which articles are most similart to each other. With our ShinyApp, we hope that users can quickly browse through relevant articles and find what they need in order to learn more about the Covid-19 virus.
👉 The name Coro2vid-19 summarizes this goal: Using information from research on coronaviruses 2 help us understand and fight the current Covid-19 virus.
How does our search engine working?
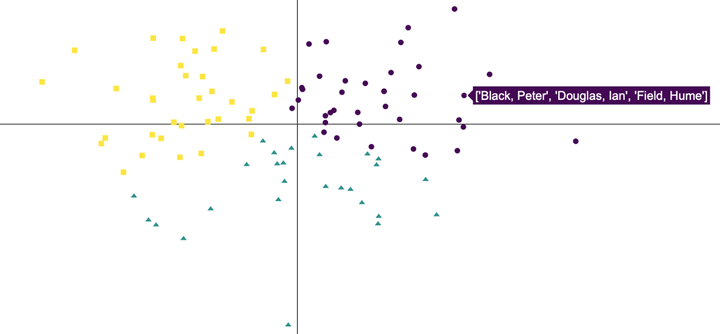
Keyword Search: Enter a keyword (such as virus) to return the most similar articles to the given keyword. The graph allows the user to modify the number of most similar articles, the number of clusters for the given articles and the time span in years when the articles are published. The graph itself can further be explored by hovering over the resulting points in the two-dimensional space to see the title of the paper along with its publication date. The table below provides a more detailed overview of the resulting articles by including the abstract as well as the estimated similarity score. Articles can be ranked by this score as well as by the publication year. Finally, authors of the articles are displayed relative to their respective similarity.

Find similar articles: Using the dropdown menu, users can select the title of a specific article and display the relative similarity of a chosen number of other articles. The resulting graph is similar to the one from the keyword search and can thus be modified using different numbers of similar articles to be displayed, vary the number of clusters and restrict the time span for publication. The table below again shows the top articles along with the similarity score and the respective abstract.

Find similar authors: Similar to the Find similar articles tab, users can here filter similar authors based on a specific author group. Results are again displayed in both a graph and a table with options to modify the results.

What did we do to build the Coro2vid-19 search engine?
We used the public CORD-19 - COVID-19 Open Research Dataset Challenge dataset from Kaggle to identify similarities of articles using the information from the abstracts of articles. Put differently, we trained an algorithm to learn the similarity of different words across more than 22,000 abstracts and represent it in a 100-dimensional vector word-vector space. Based on the similarities of words, we estimate how similar articles and authors are to each other. The resulting Coro2vid-19 search enginge is an interactive dashboard for everyone to explore and learn about (and hopefully from) the research of others!
In more technical terms, we used Tensorflow through the keras API in R to construct word embeddings using the standard word2vec pipeline as outlined
here. We end up with 50,000 words from the CORD-19 dataset represented in a 100 dimensional word-vector space. Based on this word-vector space, we used Doc2vec from the
textTinyR package to construct article and author similarities. The resulting graphs and tables show the similarities of articles and authors based on different paratmeters. Clusters in the resulting graphs are calculated using k-nearest neighbors clustering in R.
For the search engine, we used plotly and Shiny in R. Our deepest and biggest gratitude goes to
Randall Jamieson, Matt Cook,
Harinder Aujla and
Matthew Crump for their fantastic template on
semantic search engines. We build heavily on their source code to set up the graphs, tables and general appearance of the ShinyApp and would like to express our deepest appreciation for their hard work, for making the code publicly available and for their fantastic
SemanticLibrarian search engine!
Dennis Hammerschmidt
PhD Candidate | Data Scientist
I’m a PhD Candidate in Political Science working with all sorts of data sources across different statistical methods (NLP, networks, and ML) to understand and quantify the structure of international relations.